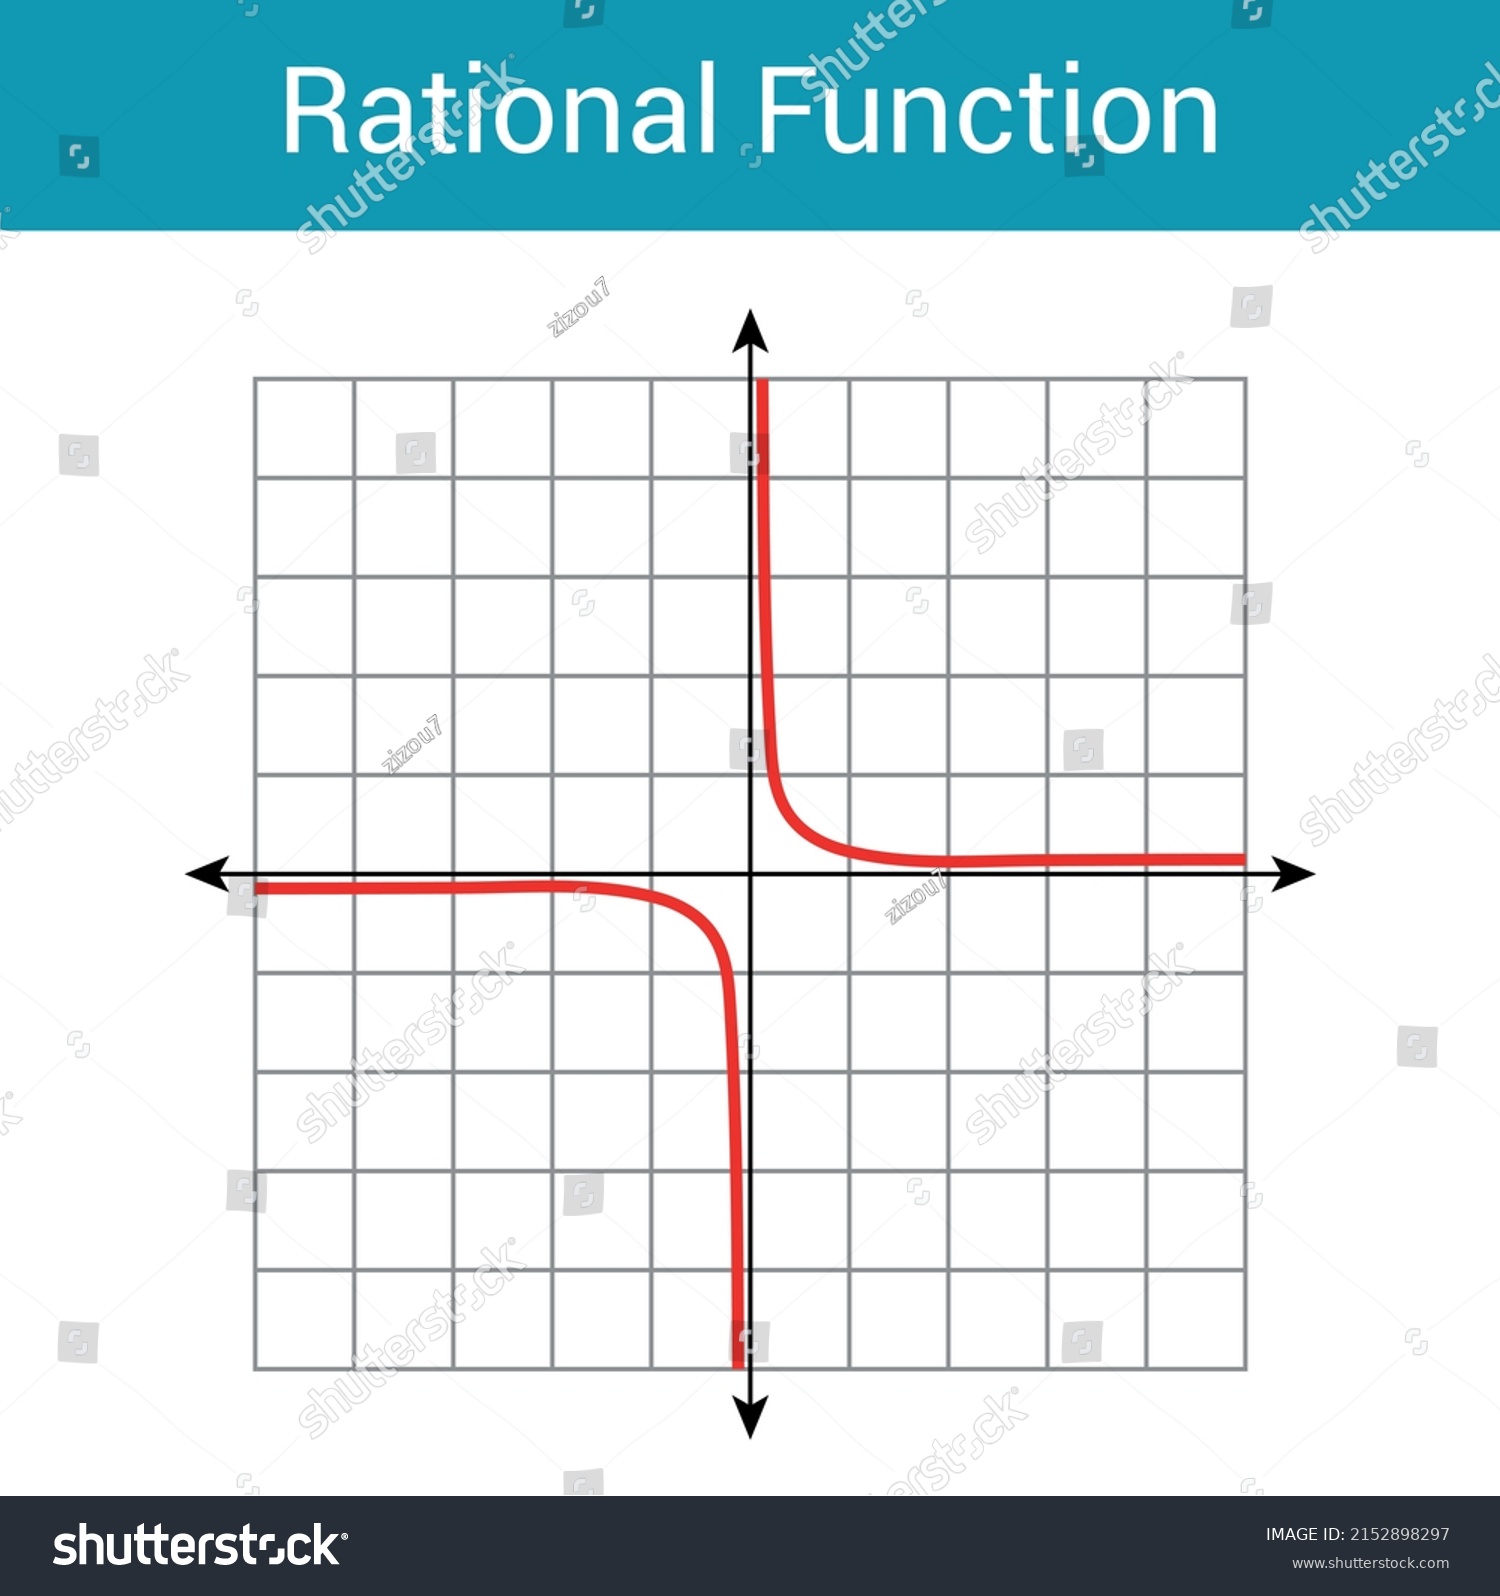
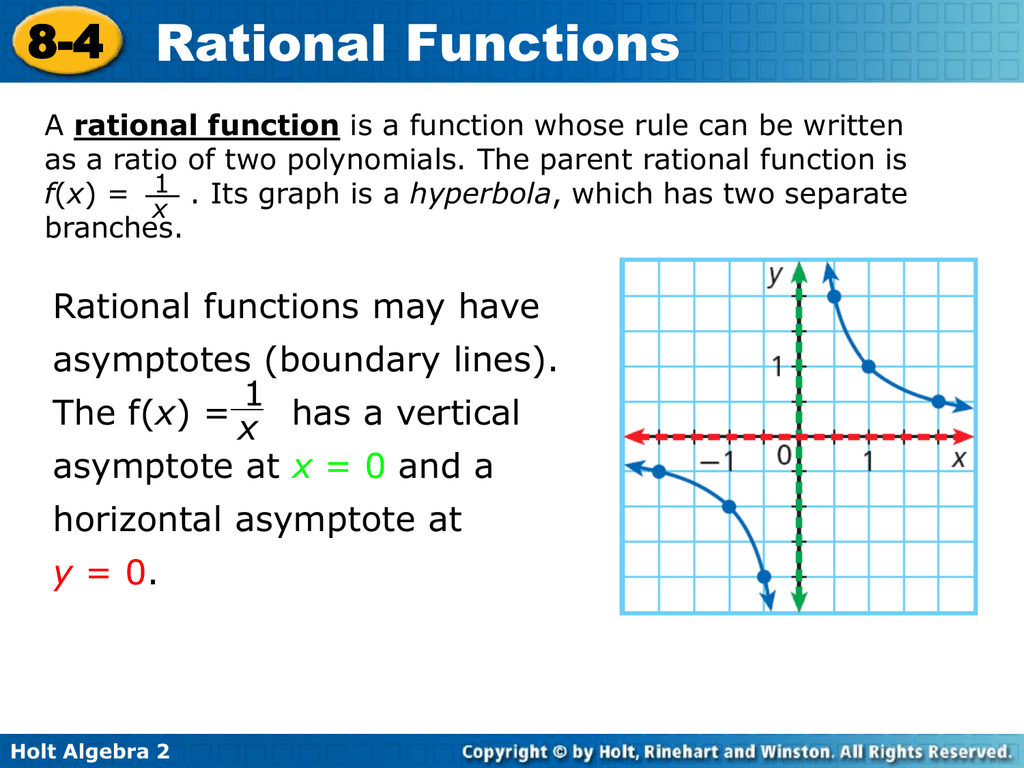
Rational Function Graph Worksheet is the essential bridge between abstract algebraic concepts and visual intuition, empowering students to confidently navigate the complexities of rational equations. By dissecting a function’s structure—numerator, denominator, asymptotes, and holes—learners gain the skills to predict behavior, identify key features, and construct accurate sketches that translate directly into real‑world problem solving.
Understanding Rational Functions
Definition and Key Components
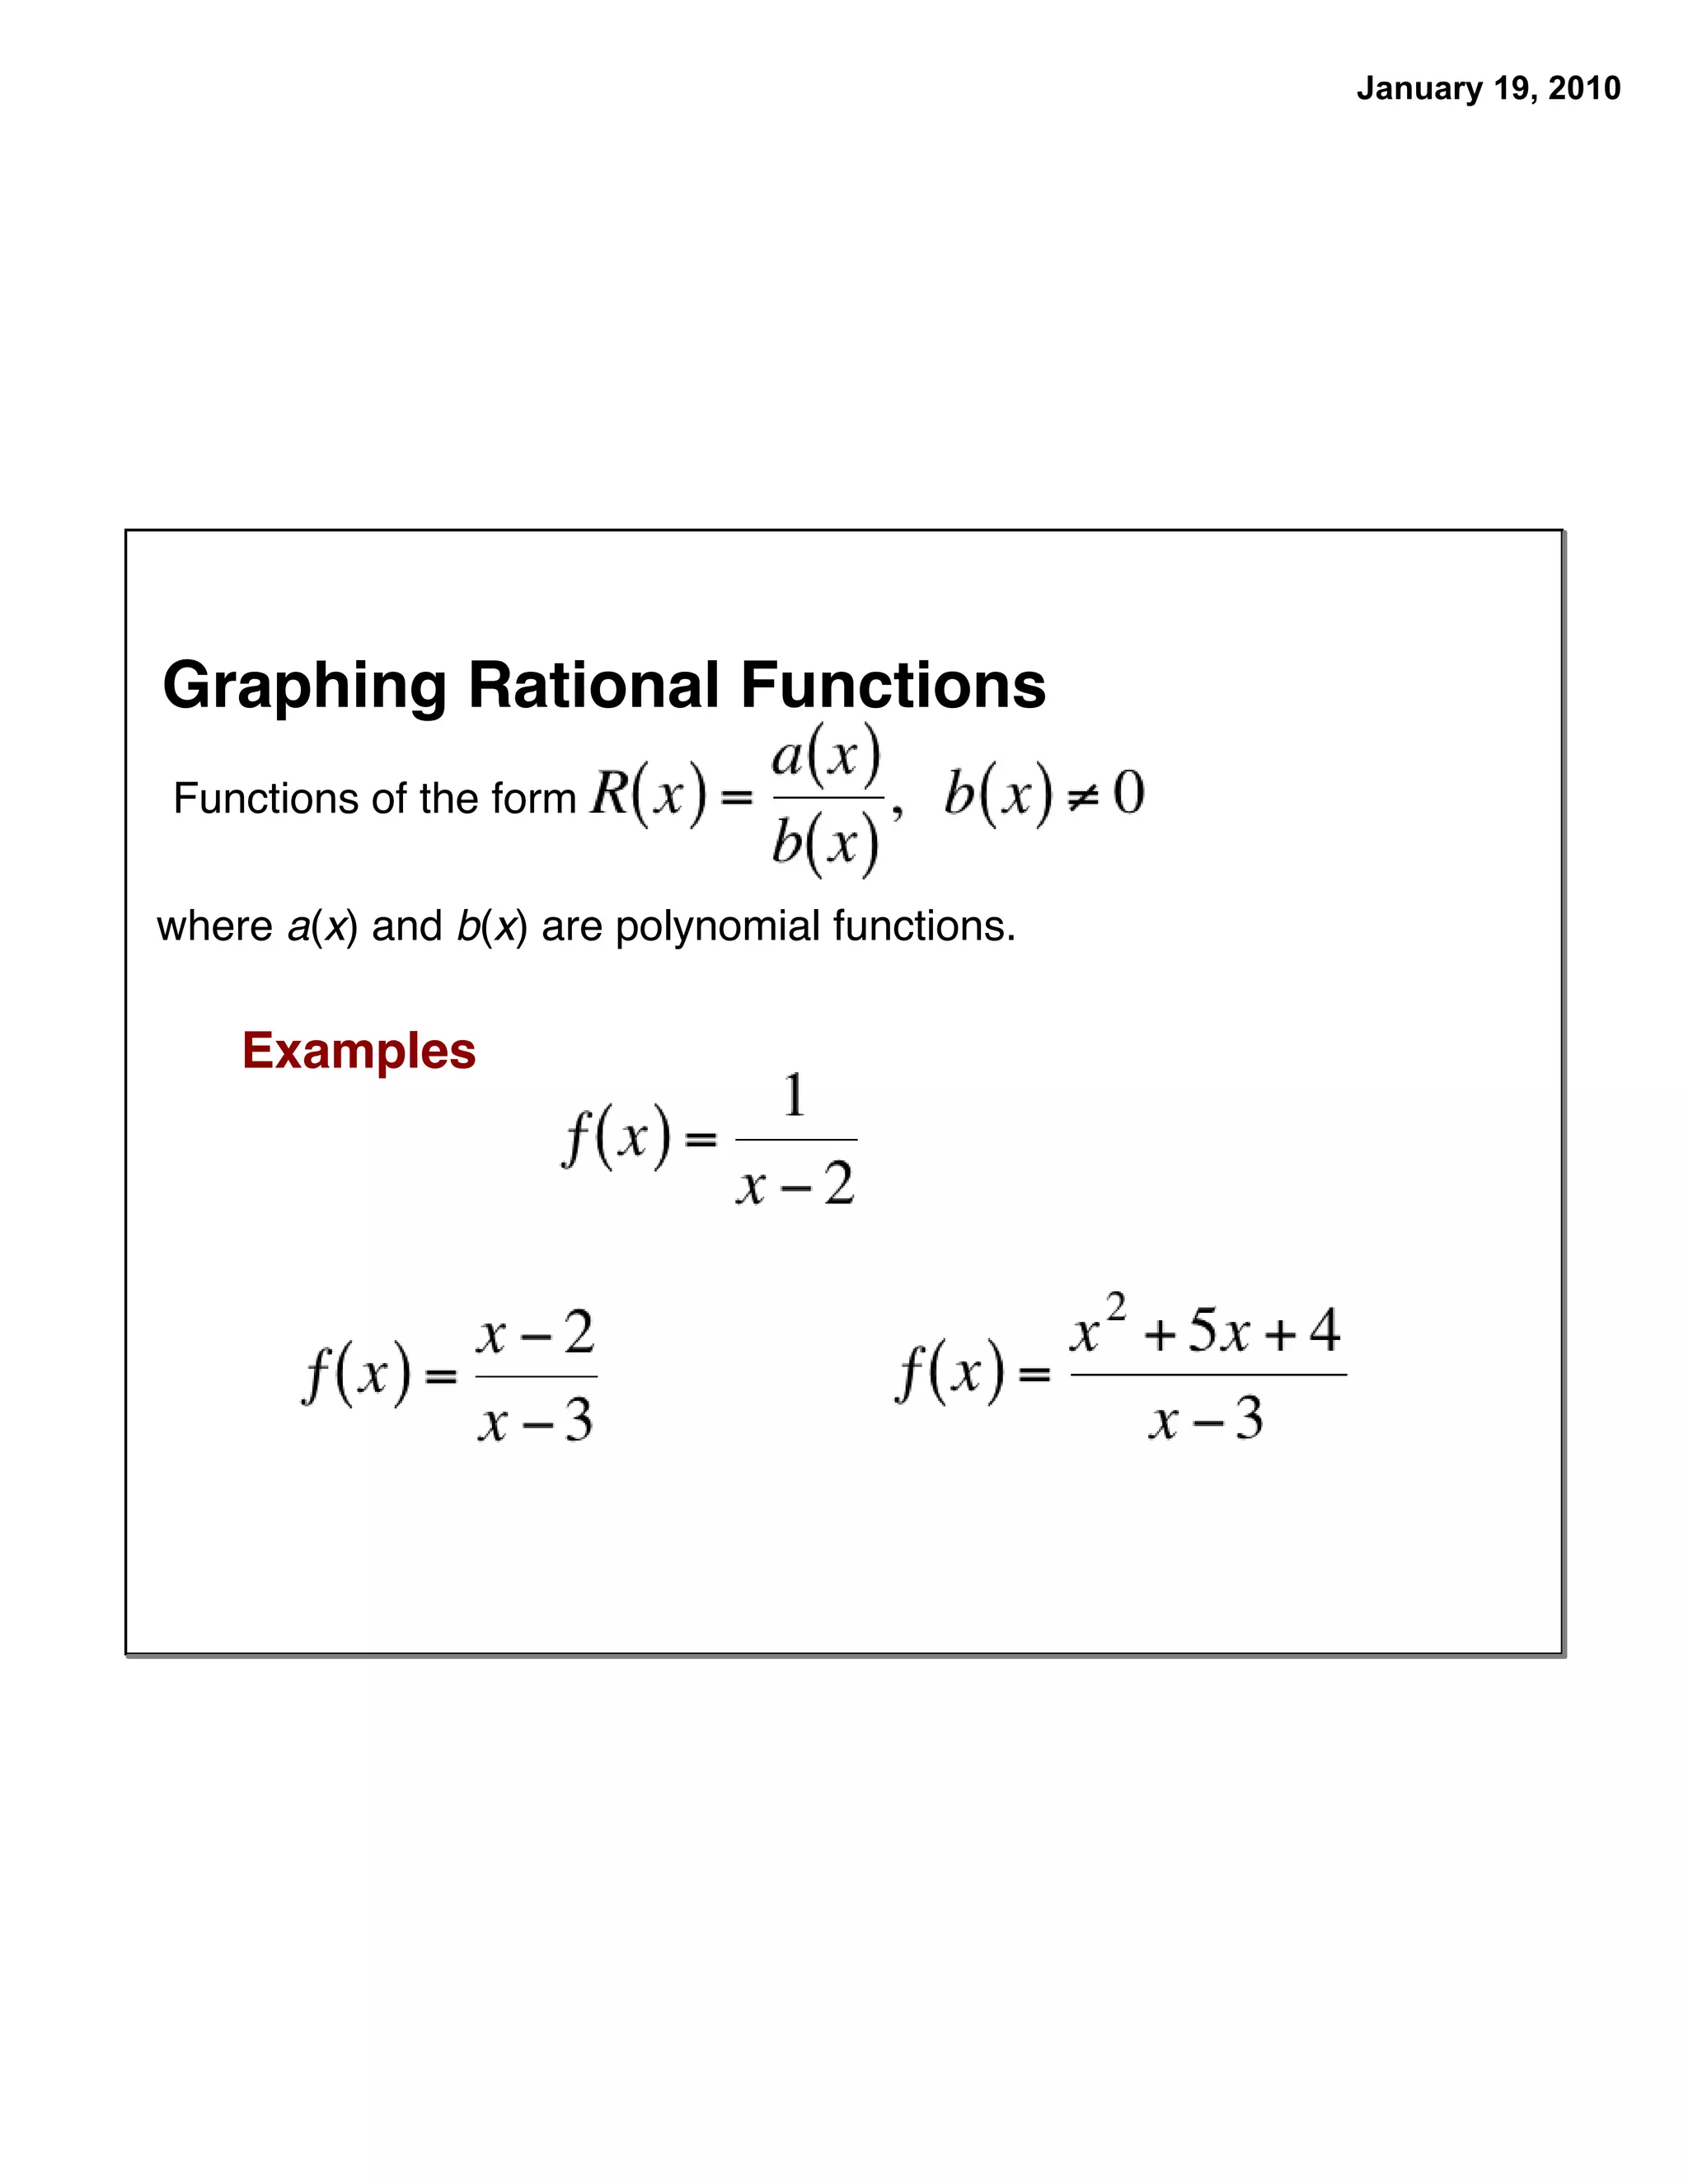
A rational function is any function expressed as the quotient of two polynomials, \(f(x)=\fracP(x)Q(x)\), where \(Q(x)\neq0\). The numerator and denominator govern distinct aspects of the graph: zeros of \(P(x)\) become x‑intercepts, zeros of \(Q(x)\) signal vertical asymptotes or removable discontinuities, and the degrees of these polynomials determine end‑behaviors. Recognizing this relationship is the first step toward mastering the worksheet.
Why Graphs Matter in Algebra and Calculus
Graphical representations reveal patterns invisible to symbolic manipulation alone. They allow students to visualize continuity, limits, and rates of change—concepts foundational to calculus. Moreover, graphing rational functions encourages a deeper grasp of limits and asymptotic behavior, a critical skill for higher‑level mathematics and applied sciences.
Common Challenges Students Face

Vertical and Horizontal Asymptotes
Many students misinterpret the behavior near vertical asymptotes, either overlooking signs or misclassifying them as holes. Horizontal or slant asymptotes dictate the function’s ultimate trajectory, and a failure to calculate them accurately can distort the entire sketch.
Hole Identification and Removable Discontinuities
When a factor cancels between numerator and denominator, a hole appears instead of an asymptote. Identifying these points requires simplifying the function first; otherwise, students might mistakenly plot an asymptote where a finite point belongs.
Sign Changes and Intervals of Increase/Decrease
Determining where the function is positive, negative, or changes monotonicity demands a careful sign chart. Skipping this step often leads to a graph that does not reflect the function’s true behavior across different intervals.
Step‑by‑Step Guide to Mastering the Worksheet

Step 1: Factor and Simplify the Rational Expression
Start by factoring both the numerator and denominator completely. Look for common factors and cancel them to expose any holes. For instance, if \(f(x)=\frac(x-2)(x+3)(x-2)(x-5)\), cancel the \((x-2)\) factor to reveal a removable discontinuity at \(x=2\) and a simplified form \(\fracx+3x-5\).
Step 2: Identify Asymptotes and Intercepts
- Vertical Asymptotes: Set the simplified denominator equal to zero and solve for \(x\). Exclude any values that were canceled in step 1, as those become holes.
- Horizontal Asymptotes: Compare degrees of numerator and denominator:
- If degrees are equal, the asymptote is \(\fraca_nb_n\), the ratio of leading coefficients.
- If the numerator’s degree is one less, the asymptote is \(y=0\).
- If the numerator’s degree is larger, perform polynomial long division to obtain a slant (oblique) asymptote.
- Intercepts: Plug \(x=0\) into the simplified function for the y‑intercept. For x‑intercepts, set the numerator to zero and solve, ensuring none cancel with the denominator.
Step 3: Analyze End Behavior
Beyond horizontal asymptotes, evaluate limits as \(x\) approaches \(\pm\infty\). This confirms whether the graph approaches the asymptote from above or below and highlights any mirrored behavior on the opposite side of the graph.
Step 4: Plot Critical Points and Holes
With intercepts, asymptotes, and holes plotted, create a sign chart to determine where the function is positive or negative. Mark any local extrema by testing the first derivative if the worksheet requires it, or by evaluating the function’s behavior around asymptotes and holes.
Step 5: Sketch the Graph with Accuracy
Using all gathered information, draw a smooth curve that respects the asymptotic limits and passes through all calculated points. Verify that the curve does not cross vertical asymptotes and that it approaches horizontal or slant asymptotes as \(x\) moves toward infinity. A well‑sketched graph should capture the function’s overall shape and nuances such as “hooks” or “loops” around holes.
Real‑World Applications of Rational Function Graphs
Economics: Marginal Cost and Profit Models
Rational functions often model cost or profit as a ratio of resources to output. For example, a company’s cost function \(C(x)=\fracax+bcx+d\) may reveal economies of scale and point toward optimal production levels. Graphing this function exposes thresholds where costs spike due to constraints.
Physics: Projectile Motion and Decay Rates
In decay processes, the rate of change may be expressed as \(R(t)=\fracKt+1\), a rational function whose asymptotic behavior indicates long‑term decay trends. Similarly, certain projectile trajectories under air resistance can be approximated by rational equations, providing a visual tool for predicting peak heights and ranges.
Engineering: System Stability and Control
Control theory frequently employs transfer functions—ratios of polynomials—to describe system responses. Understanding the poles (denominator roots) and zeros (numerator roots) through graphing helps engineers predict oscillations and ensure stability in feedback loops.
Tips for Teachers to Use the Worksheet Effectively
Incorporate Interactive Digital Tools
Graphing calculators or online graphing platforms allow students to see dynamic changes as coefficients vary. Encouraging exploration beyond static worksheets deepens conceptual understanding.
Provide Scaffolding with Step‑By‑Step Hints
Design worksheets that progressively reveal information. For instance, first ask students to identify asymptotes, then to plot intercepts, and finally to sketch the curve. This layered approach reduces cognitive overload.
Use Peer Collaboration and Peer Review
Pair students to compare sketches, discuss discrepancies, and explain reasoning. Peer review promotes active learning and helps surface common misconceptions.
Assess Understanding Through Formative Quizzes
Short quizzes focusing on individual skills—factoring, asymptote calculation, sign chart creation—allow instant feedback and targeted reteaching before tackling the full worksheet.
Common Mistakes and How to Avoid Them

Forgetting to Simplify Before Finding Intercepts
Students often calculate x‑intercepts using the original numerator, inadvertently including roots that cancel with the denominator. Always simplify first, then solve for zeros of the reduced numerator.
Misplacing the Graph Across Quadrants
Because rational functions can change sign rapidly near asymptotes, it is easy to misplace sections of the curve. A thorough sign chart helps confirm the correct quadrant placement.
Ignoring End-Behavior Symmetry
Failing to verify that the graph approaches the horizontal or slant asymptote on both sides can lead to asymmetrical sketches. Checking limits at both \(-\infty\) and \(+\infty\) ensures symmetry or reveals genuine asymmetry.
Overlooking Horizontal/Slant Asymptotes
Students sometimes focus solely on vertical asymptotes and intercepts, neglecting the function’s long‑term behavior. Always calculate and mark the horizontal or slant asymptote before finalizing the sketch.
Conclusion: Unlocking the Power of Rational Graphs

Mastering a Rational Function Graph Worksheet equips students with a versatile analytical toolkit—enabling accurate predictions of function behavior, facilitating problem‑solving across disciplines, and building confidence for more advanced studies. By following a systematic approach—factoring, identifying asymptotes, plotting critical points, and meticulously sketching—the daunting task of graphing rational functions becomes a clear, logical exercise. Whether in the classroom or in real‑world applications, these skills illuminate the underlying structure of complex relationships and open the door to deeper mathematical insight.